

Introducing the DTO Cycle Allocator: Beat the S&P 500 at Half the Risk
Now part of the Defy the Odds subscription.

Over the last few months, between managing the portfolio, writing Substack, and researching trade ideas, I built something I want to share with you today.
When the idea of Defy the Odds came to me last summer, I wanted this to be a place where you do not just get a trade idea. You get a system. A process you can rely on, especially in the hard times. A process built on the experience of someone who has spent real time on each side of the table: as a central banker, a macroeconomist, an equity analyst, and an investment manager. Twenty years across those four seats. That is a broad background, and I wanted to put that knowledge into one place. This Substack is that place.
After months of work, the DTO Cycle Allocator is finished. What is it? It is a long-term capital allocator. It tells you when to hold stocks, bonds, gold, commodities, or cash. It is built on the same Macro Quads I show you every week, so many of you already know the fundamentals.
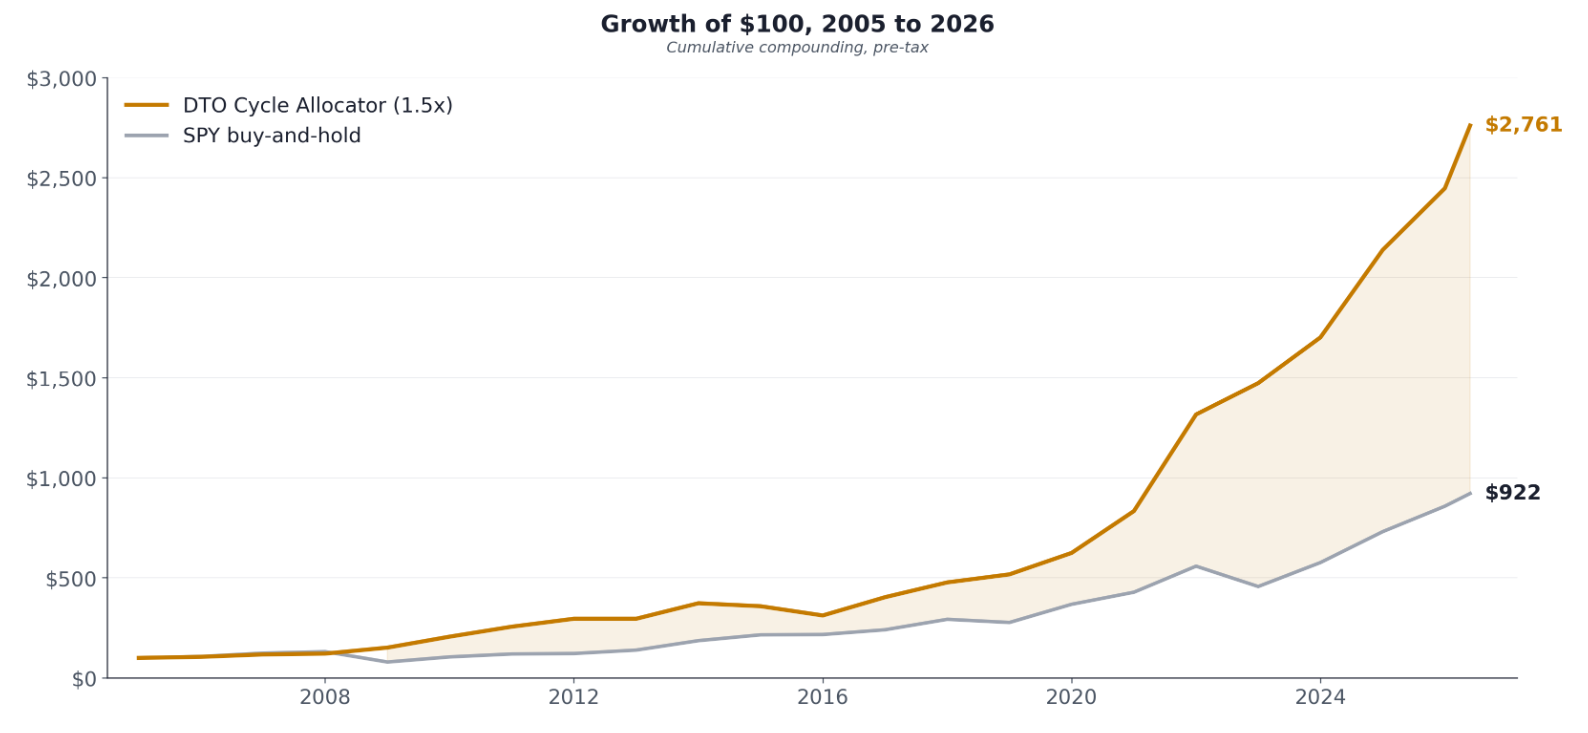
The model returns nearly 17% a year, against the S&P 500’s almost 11%, and it matches or exceeds even the strictest benchmarks. What does it mean? In dollars: $100,000 invested in the S&P 500 in January 2005 sits at roughly $923,000 today. The same $100,000 run through this strategy is roughly $2,761,000.
It is now part of the Defy the Odds subscription package.
In this post I show you how the system works in detail, because I want you to trust it because you understand it. But before we get into the mechanics, I want you to understand what Defy the Odds gives you in this new setup.
The DTO Cycle Allocator keeps you in the trends long enough. It tells you when you can be aggressive. It helps you rotate to defensives in time, and get aggressive again when the cycle turns. This is not a short-term model. It is designed to capture the big picture. Think of it as the strategic level of investment.
Around that strategic layer, the rest of the framework does the tactical work:
The Macro Monday Playbook tells you that big picture in plain language, and hunts for opportunities inside the multi-month, sometimes year-long, macro regime.
The Intermarket Macro Map exists to find the profitable rotations inside a single macro regime, in time.
The deep dives dissect the megatrends that shape the macro and the stock selection environment.
The stock selection ideas combine macro, fundamentals, and technicals. The last one was FSLR, which printed 40% in three weeks.
The main idea?
The DTO Cycle Allocator gives you the long-term returns above the S&P 500, based on past returns of course.
But there are ways that yearly return can be improved.
Instead of holding plain SPY, clever industry or country ETF selection can produce higher returns, and that is before the stock selection part.
At times, tactical futures positions can sharpen the return profile too.
Besides the new model, every part of the Defy the Odds subscription is geared to this one idea: take the strategic return the Allocator produces, and trade around it to make it better.
It matched Risk Parity’s Sharpe and tripled SPY in cumulative return
So let us get to the point. Before any of the mechanics, here is what the model actually did over 21 years.
An asset allocator decides what you own across asset classes, not which stock you pick. This is the foundation of everything. Make a mistake here and you cannot do the rest properly, because no amount of clever stock picking saves a portfolio that is in the wrong asset class for the regime. Most retail investors handle it badly. They sit in cash at the end of the rally, FOMO at the worst possible entry, and capitulate near the bottom of the correction. An asset allocator has one job, which is to prevent exactly that. It keeps you continuously in the asset class with the best risk-reward for the current macro regime.
The Allocator does that mechanically, on rules I committed to in writing before the first backtest ran. Here is what came out.
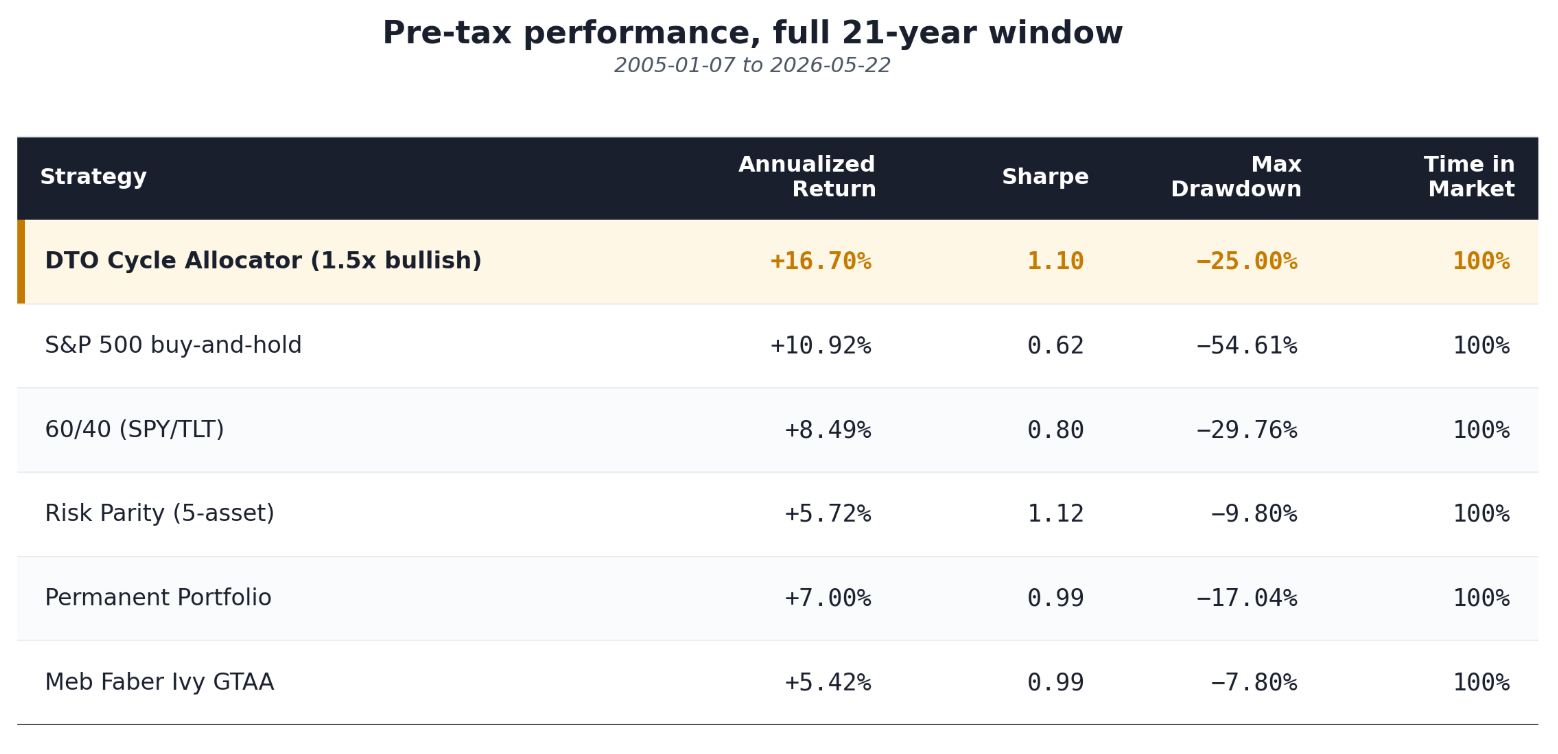
All numbers are pre-tax weekly returns, full 21.4-year window, no survivorship, no selective benchmarks. The Allocator runs in two configurations. The 1.5x version applies selective leverage in bullish regimes only and is the headline strategy of this post. The 1.0x core version is the same engine without leverage; it is the natural fit for accounts that do not permit margin (IRA, Roth, ISA, LISA, 401k, pension wrappers). The same underlying playbook drives both.
Read these tables sideways, not top down. The return columns are not where the real edge lives.
The first column you should look at is Sharpe. The DTO Cycle Allocator at 1.5x produces a risk-adjusted return that is statistically indistinguishable from Risk Parity, the standard institutional multi-asset benchmark. Risk Parity is famously hard to beat on Sharpe. Most retail and tactical strategies that try, fail. The Allocator matches it, while delivering nearly three times the absolute return. The 1.0x core actually edges past Risk Parity at 1.17. Either configuration sits at the institutional-quality risk-adjusted level. The difference between them is how much absolute compounding you want to extract from that level.
The second column to look at is drawdown. SPY drew down 54.6% in 2008. To recover from a 54.6% drawdown you need to gain 120%. That is six years of compounding at a 14% rate, just to get back to where you started. The Allocator’s worst drawdown across 21 years was 25.0%, and it took about 14 months to recover from the trough. The 2.2x improvement in worst drawdown is what allows the Sharpe to be what it is, and it is the difference between a strategy you can hold through a recession and a strategy you abandon at the wrong moment.
The third column is return. The Allocator at 1.5x produced 16.7% annualized, versus SPY’s 10.92%. The gap is 5.8 percentage points per year. Over 21 years, starting with $100,000, that is roughly $1.84 million in additional terminal wealth. The return alone would be a reasonable result. The Sharpe and drawdown improvements are what justify the architecture.
One note on methodology before we move on. The headline numbers are pre-tax. The numbers are pre-tax because in a tax-deferred account that is the number that matters, and in a regular taxable account the weekly rotations do get taxed, yet the strategy still beats SPY by a meaningful margin in absolute terms even after that. SPY’s buy-and-hold return is identical pre-tax and post-tax-until-exit, so the Allocator’s pre-tax figure is the same kind of number, computed the same way. The two are apples to apples.
How the model works
The Allocator is short by design. Two macro axes determine the regime. Four regimes determine the playbook. Three overlays refine entries, exits, and partial re-entries. Five assets receive the weights.
It is deliberately this compact. Adding inputs makes a model look better in backtest but tunes it to the regime that dominated the sample, then breaks when the regime turns. The DTO Cycle Allocator goes the other way. Two scores, four regimes, one playbook each. What makes it robust across regimes is what it leaves out.
The two regime scores. The Allocator reads two macro nowcast scores every Friday close: Growth and Inflation. Each is a composite z-score against its own multi-year baseline.
The Growth score is a 45/40/15 blend of three components. The ISM Composite (45%) reads the New Orders minus Inventories spread for manufacturing and services, a forward-looking signal that turns before the headline numbers do. Corporate Health (40%) tracks the Citi US Earnings Revisions index and the breadth of positive earnings revisions across the S&P 500. The Copper-to-XLP ratio (15%) is the market’s own cyclical read: industrial metal versus consumer staples.
The Inflation score has three pillars. Impulse is the ISM Prices Paid composite for manufacturing and services. Level is the Atlanta Fed Sticky Core CPI year-on-year, which is less noisy than the headline number and harder to push around with one-off energy or food prints. Expectations is a 50/50 blend of the 5Y breakeven and the 5Y5Y forward inflation. The three pillars are not equally weighted. The weights move with the prevailing CPI YoY regime:
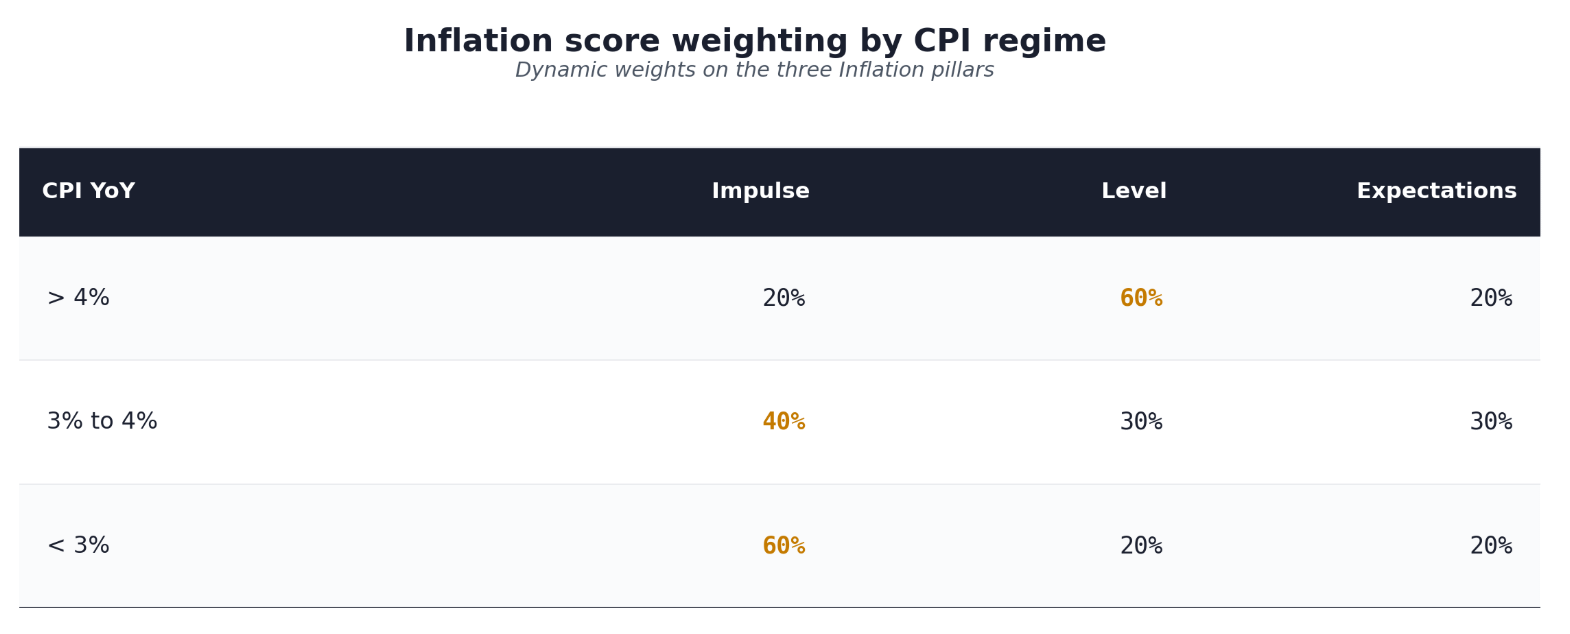
The logic. When inflation runs hot, the market already knows we are elevated, and what matters is whether the level holds or breaks. When inflation runs cool, the level is not the binding constraint, and what matters is whether the impulse is turning. The dynamic weighting means the same z-score reading carries different signal weight in a 2% inflation world and a 6% inflation world, which is what makes the Allocator hold its shape across regimes that the same fixed-weight model would misclassify.
Every macro input is publication-lag corrected. The model uses each data point only from the date it was actually released to the public (CPI 42 days, Sticky CPI 46 days, ISM Manufacturing 30 days, ISM Services 32 days, Citi Earnings Revisions 14 days, Earnings Breadth 44 days). Breakevens and the Copper-to-XLP ratio are daily market data, no lag. This eliminates the look-ahead bias that affects most published macro backtests.
The four regimes. Growth and Inflation signs determine which quadrant the global macro is in.
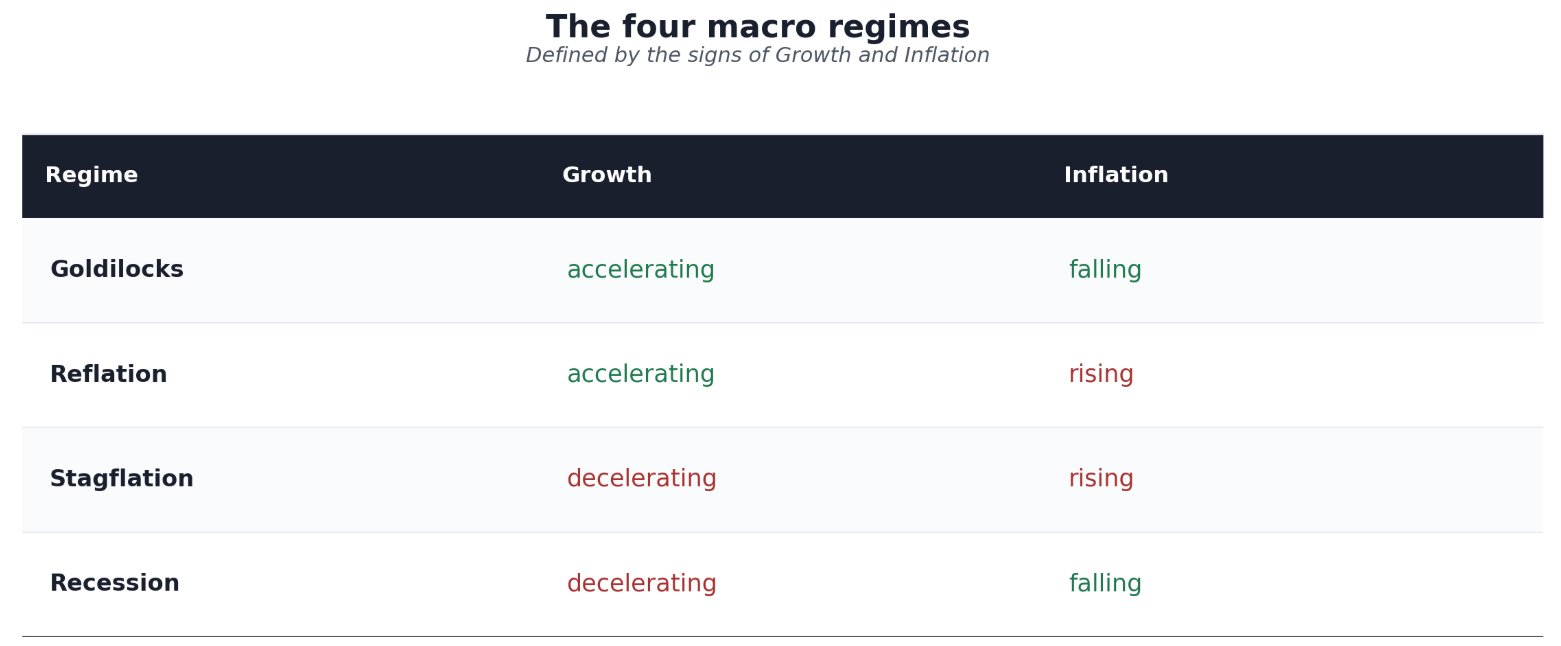
Two reads, four states. Nothing else changes the regime label.
The playbooks. The Allocator runs in two configurations. The 1.0x core is the playbook with no leverage. The 1.5x configuration applies selective leverage in bullish regimes only.
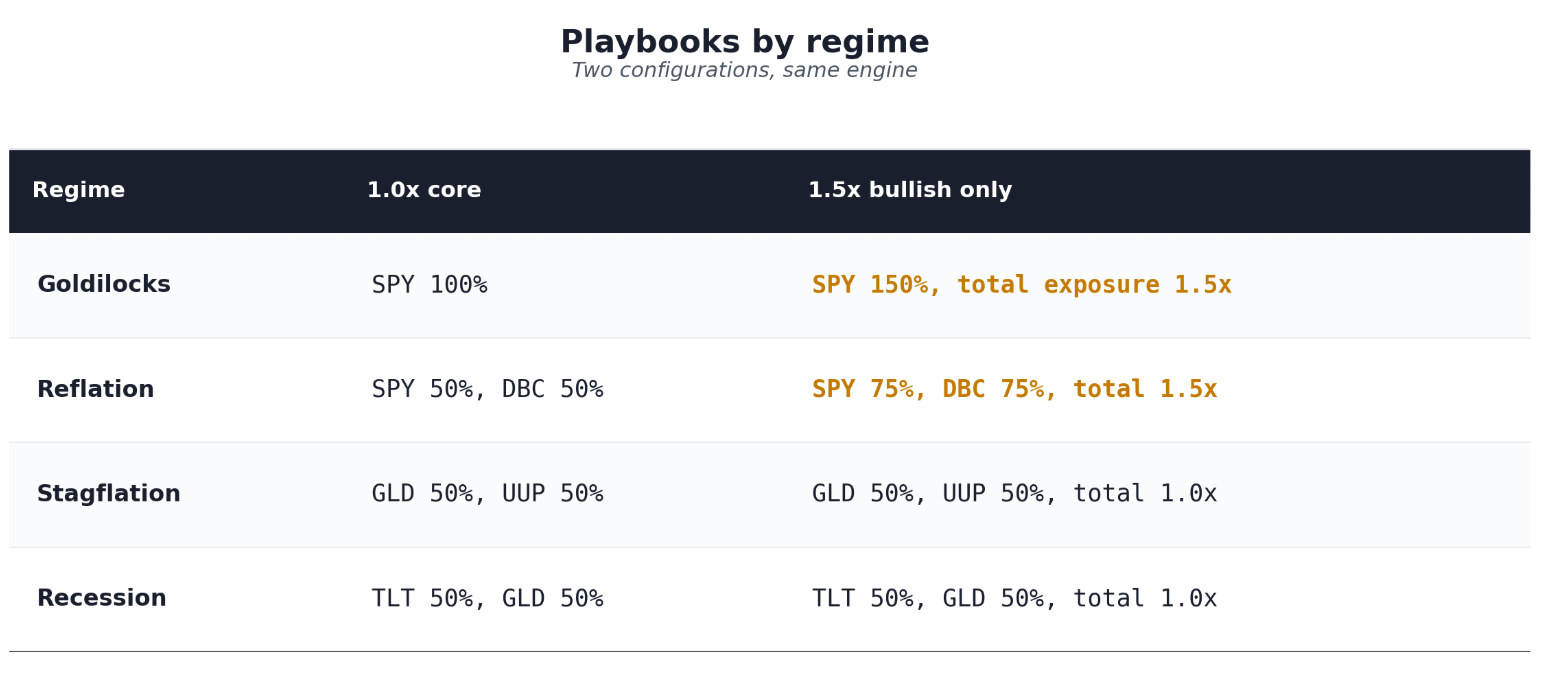
Market history is clear that large and sustained drawdowns do not happen when growth is positive and the macro is on equities’ side; the downside is bounded enough to defend leverage. Borrow cost is modeled at the federal funds rate plus a 1% spread, weekly priced. The headline numbers above are net of that cost.
The three overlays.
20MA Gate. Confirms regime entries on the bullish side. When the macro flips from defensive to bullish, the rotation is held until SPY weekly close confirms above the 20-day moving average. If the macro reverts to defensive before that confirmation, the pending rotation is cancelled. Protects against false breakouts where the fundamentals improve but the market has not yet caught the trend.
Trend Filter. Delays defensive rotations when the SPY uptrend is intact, using a four-week pivot window and one confirmed higher low. Fires only on bullish-to-defensive transitions, never the other direction. The trigger to actually rotate defensive is when SPY closes below the most recent confirmed higher low. The asymmetry is deliberate: rotate immediately when the regime turns risk-on, wait patiently when it turns defensive but the trend is still alive.
Permission Rule (PR). Catches bottoms inside defensive regimes via a four-condition gate. The model blends 50% SPY into a defensive playbook when, simultaneously: the regime is Stagflation or Recession, SPY has drawn down 10%+ from a 52-week peak in the current defensive episode, SPY’s 4-week return beats the defensive composite, and SPY shows a confirmed higher-low chain. The blend is held until the regime flips back to bullish or SPY closes below its anchor higher low.
The 20MA Gate solves the case where the macro turns bullish but the market hasn’t yet. The Trend Filter solves the case where the macro turns defensive but the market is still rising. The Permission Rule solves the case where the macro is still defensive but the market has already bottomed. Three overlays, three separate timing problems, three explicit rules.
Audit-first protocol. Every block, weight, and overlay was written down with its economic rationale before the first backtest. Weights were frozen after the first run and never tweaked to fit the result.
A note on the window. The 21-year backtest, 2005 to 2026, is not a window I picked. It is the longest one where every macro component the model needs is reliably available. Before 2005, several underlying series do not exist or are too sparse to z-score consistently. Twenty-one years is what clean apples-to-apples data allows. The pre-2007 UUP and pre-2006 DBC exposures are backfilled from DXY-plus-Fed-funds-carry and Bloomberg Commodity Index respectively, both with annual fee drag modeled in, to keep the playbook at full intended exposure across the early window.
The model performs best in the worst years
Headline numbers across 21 years are averages. Averages hide which regimes built the alpha and which years the Allocator held discipline against a market that disagreed.
Where the Allocator's hourly compounding happens, regime by regime.
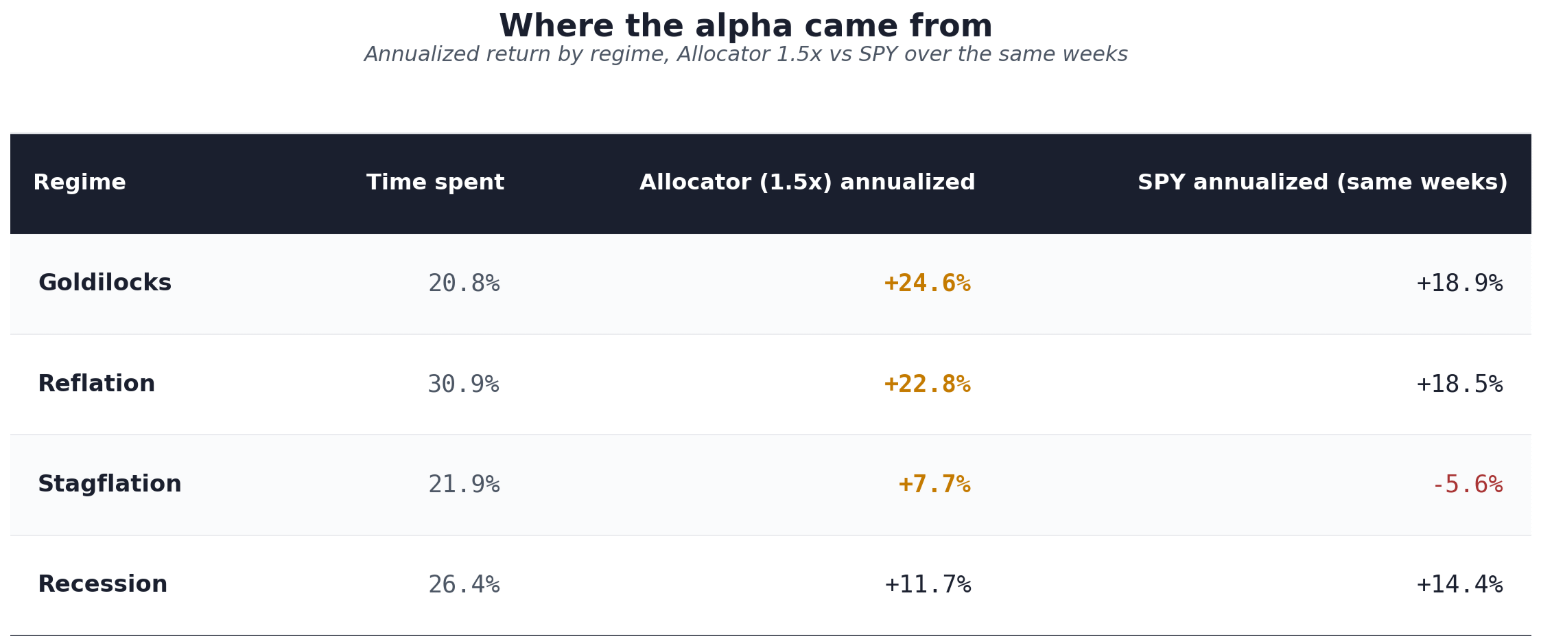
Half the weeks in the window were classified bullish (Goldilocks or Reflation). In those weeks, the Allocator runs at 1.5x and extracts more than 22% annualized in both regimes. The other half is defensive. Stagflation is the regime where the Allocator earns its keep not by winning but by not losing; +7.7% annualized in an environment where SPY annualized a negative number across the same weeks. Recession is the only regime where SPY edges the Allocator (+14.4% vs +11.7%), and that is by design: the Recession playbook holds TLT and gold during weeks the macro has classified Recession, regardless of whether equities subsequently recover. The PR catches the recoveries that come fast enough; the rest is the cost of staying defensive in correctly classified Recession weeks.
Yearly returns, full window. The headline 1.5x configuration against SPY. Full year-by-year alpha for both configurations is in the trade log.
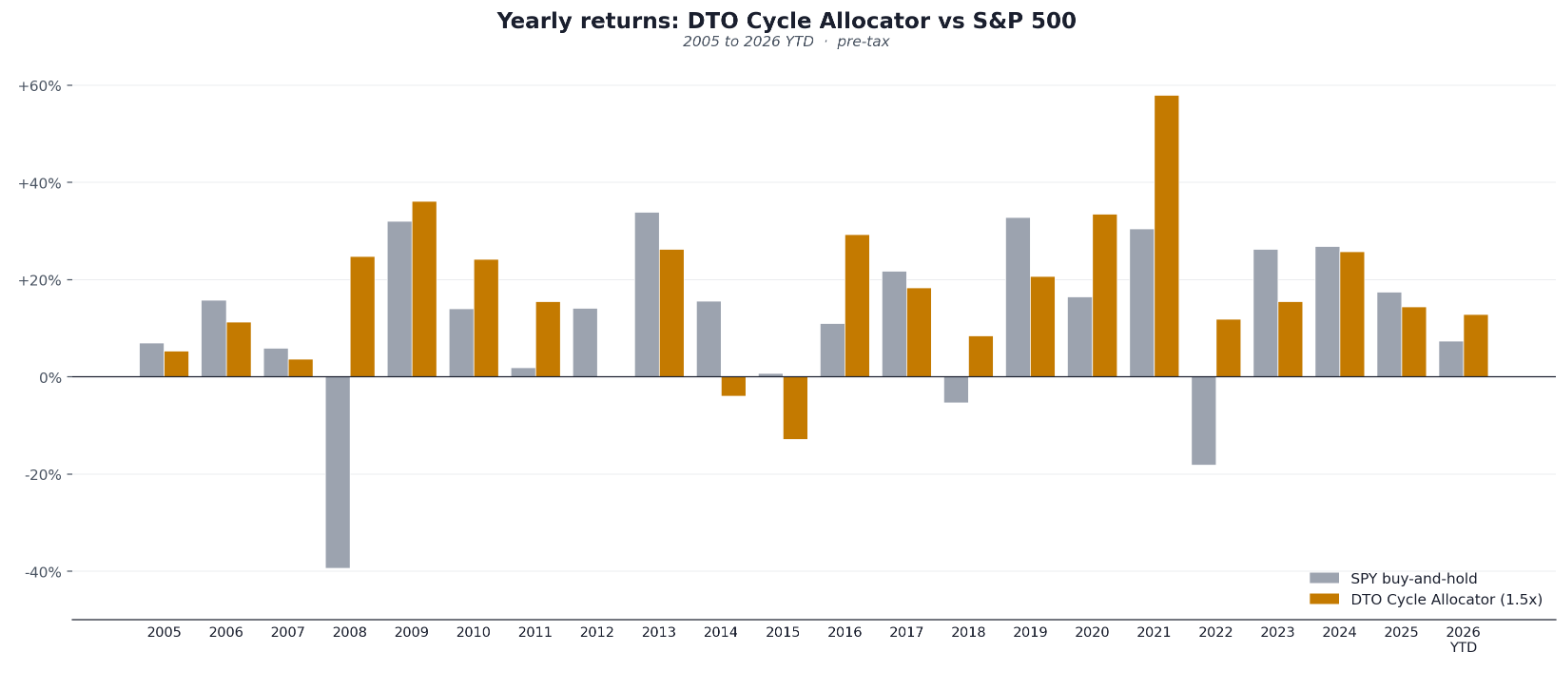
The pattern in this table is the whole thesis. Look at the years SPY lost money: 2008 (-39.4%) and 2022 (-18.2%). Those are the two years the Allocator put up its biggest spreads, +64 and +30 percentage points. The model does its best work precisely when the market does its worst. That is not a coincidence; it is the architecture. The next section walks through how it happened, year by year.
Understanding the best and worst years of the framework
Several years tell the architecture’s story better than the aggregate. I will walk you through the wins, then the losses.
2008. The financial crisis. SPY -39.4%, drew down 54.6% peak to trough. The Allocator at 1.5x finished 2008 at +24.8%, a 64-point spread. The macro engine had already moved into Stagflation by late 2007 as Growth rolled over while the Inflation block stayed elevated. By the time Lehman fell in September, the regime was still Stagflation and the playbook was 50% gold and 50% dollar; both rallied hard through the credit collapse. The Recession transition came in November as Growth deteriorated further and the inflation impulse collapsed, and the playbook rotated into TLT and gold for the rest of the move. The Trend Filter did not block any of these rotations because the SPY uptrend had broken cleanly. The Allocator held the defensive posture through the entire collapse and into the 2009 recovery. Without a regime framework, there is no third option to “hold SPY through -56% and capitulate near the bottom” or “hold and tell yourself it is fine”.
2020. The COVID shock. SPY +16.4%. The Allocator at 1.5x finished 2020 at +33.5%, a 17-point spread. The model entered 2020 with PR active from a Recession episode that started in mid-2019; the 50% SPY blend in defensive carried into the COVID drawdown. When SPY broke below its anchor higher low in March, the PR blend exited on that trend break and the Allocator went to the pure defensive Recession playbook (TLT and gold) in time to catch the bond rally during the worst weeks of the panic. The macro engine then cycled to Goldilocks by mid-year as the policy response showed up in Growth and the Inflation impulse stayed contained, then on to Reflation by September. The 1.5x leverage applied through the second half. PR did what PR is supposed to do, which is keep the model partially in equities through the deepest defensive episode, then step out cleanly when the trend it was anchored to actually broke.
2021. The leveraged year. SPY +30.4%. The Allocator at 1.5x finished 2021 at +57.9%, a 27-point spread. A full year of Reflation labels, the leverage applied throughout (75% SPY, 75% DBC), the trend overlays did nothing because nothing needed to happen. This is what 1.5x earns when the macro is genuinely on equities’ side and nothing breaks. Years like 2021 are how the cumulative wealth gap opens up.
2022. The rate-shock bear. SPY -18.2%. The Allocator at 1.5x +11.9%, a 30-point spread. The Inflation block flipped at the end of 2021. By the time the Fed started hiking in March, the Allocator was in the Stagflation playbook: 50% gold, 50% UUP. The dollar ran one of the strongest rallies in twenty years. The 50/50 blend produced a positive year in an environment where almost every long-only strategy lost money. The interesting detail is what the Allocator did not do. It did not flip to Recession when the equity drawdown deepened. The macro blocks correctly identified Stagflation, where bonds hurt because rising rates hurt them. A Recession playbook with TLT would have lost roughly 16% alongside SPY. Distinguishing Stagflation from Recession was worth roughly 28 percentage points.
Now the years the Allocator lost, because pre-registered rules cost as well as pay.
2014-2015. The worst stretch. SPY +15.6% then +0.7%; the Allocator at 1.5x finished -4.0% and -12.9%, the only negative year in the window and the backtest’s worst drawdown at -25.0%. The macro read Reflation through mid-2014 and held commodities right as the great commodity bear began, then the growth signal whipsawed between Goldilocks and Recession through 2015. The inputs never produced a clean, persistent signal, so the model kept rotating into positions that reversed before they paid, which is exactly what the overlays cannot help with. The cost of pre-registered rules with no override, and an obvious thing to improve in a future version.
2019. The longest bull market. SPY +32.8%. The Allocator at 1.5x +20.7%, a 12-point drag. The macro engine sat in Recession for large portions of 2019; the yield curve had inverted in May, manufacturing was in a recession of its own, and the Fed cut three times. The Allocator held TLT and gold while equities ran. PR activated mid-year as SPY drawdowns triggered the sticky-DD condition, which softened the drag, but the model was still net underweight equities in a year SPY annualized over thirty percent. The rules said defensive; the market said up. The rules cost roughly 12 percentage points in a year I had clear macro visibility. This is what pre-registration is for. Not picking winners. Accepting the trade.
2023. The AI rally. SPY +26.2%. The Allocator at 1.5x +15.5%, an 11-point drag. The AI capex cycle pulled the S&P higher through a handful of concentrated names while macro blocks failed to register clean Goldilocks. Inflation was still sticky, growth was uneven, liquidity was tightening. The Allocator stayed cautious through a rally that was real but largely outside the macro framework supposed to predict it. As with 2019, this is the cost of running pre-registered rules. You accept years like 2023 in exchange for years like 2008 and 2022.
The takeaway is this: The losing years are part of every system. No exceptions. The real value is protecting you in the most challenging times, keeping you in the game long enough that you have a chance to win it. A strategy that wins big in the good years and ruins you in the bad ones is not a strategy you can hold. This one is built to be held.
Audit it yourself. The full trade log is downloadable as an xlsx file.

Let’s see what this means in numbers
The only number that ultimately matters is the balance an account shows after 21 years. Here is the same 21-year window translated into terminal wealth at five different starting capital levels, pre-tax.
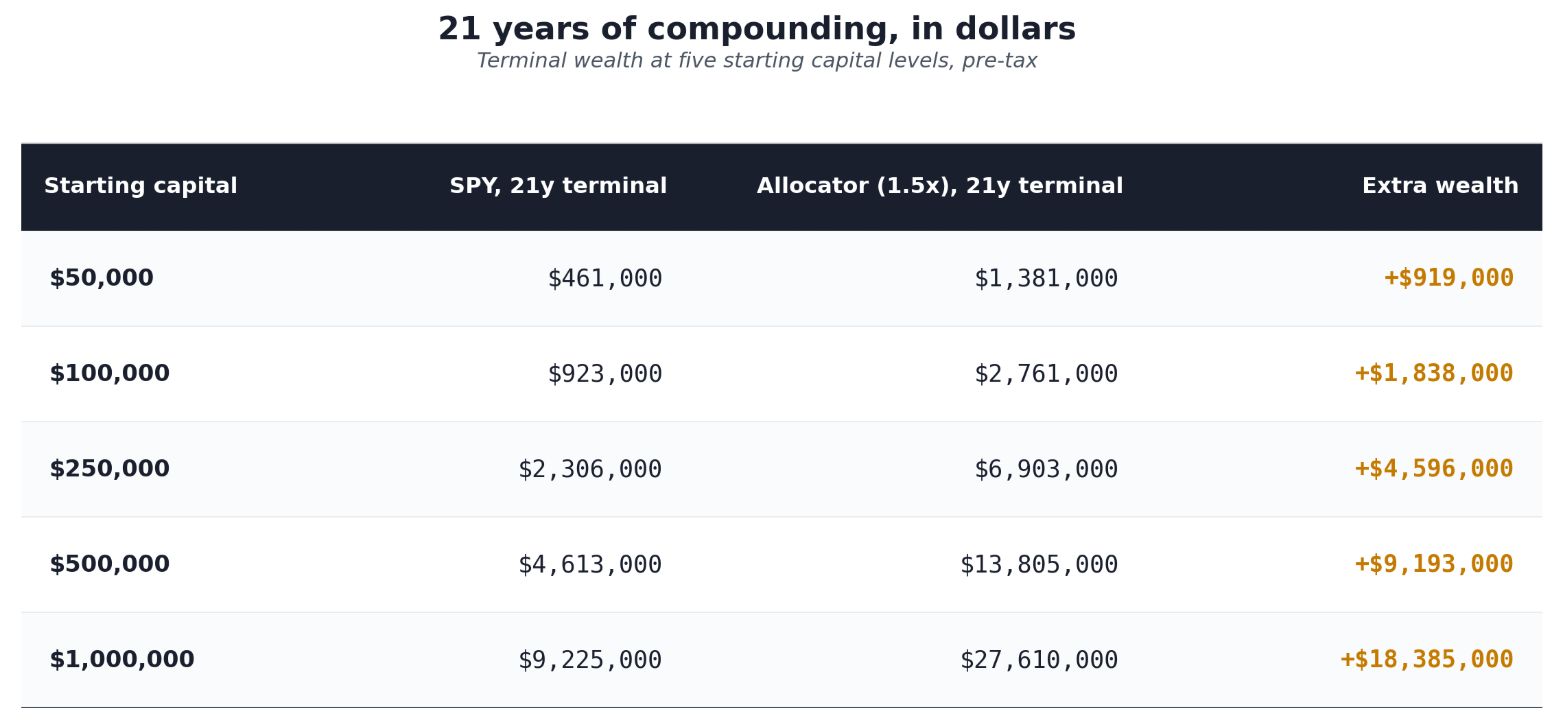
The 5.8 percentage point annualized gap, compounded across 21 years, turns into multiples of terminal wealth. That is what a properly designed asset allocator earns over a complete cycle of regimes. The mainstream view, that no strategy reliably beats SPY long-term, is correct for raw returns in a single disinflationary equity bull market. It is wrong for terminal wealth across a complete cycle of regimes, including the drawdowns SPY does not survive without leaving the investor down 50% or more. The 21-year audit trail above is the evidence.
For accounts that do not permit margin, the 1.0x core variant produces $1,622,000 on $100,000 over the same window. That is $699,000 of extra wealth over SPY at the same starting capital, with a 20.6% worst drawdown instead of 25.0%. A subscriber chooses the configuration that fits the account structure available to them.
Now the subscription math.
The yearly subscription is $700. The Allocator at 1.5x produces 5.8 percentage points of advantage over SPY per year on average across the 21-year window. The breakeven portfolio size, the point at which the long-run added return exactly covers the yearly fee, is roughly $12,000. On any portfolio above that, the Allocator is paying you to be a subscriber, on average, from year one. And this is just the Allocator part, not the whole Defy the Odds framework.
On a $100,000 portfolio, the average annual added return at the 5.8 percentage point gap is roughly $5,800. That is 8.3 times the yearly fee.
On a $250,000 portfolio, the average annual added return is roughly $14,500, or 21 times the fee.
Over a 21-year holding period on that same $250,000, the cumulative extra terminal wealth is roughly $4.6 million versus a cumulative subscription cost of $14,700. The ratio is over 300 to 1.
Then there is the drawdown side, which is a different number entirely.
2008: SPY fell 54.6% peak to trough; the Allocator drew down about 8%.
2022: SPY fell 23.9% and finished -18.2%; the Allocator finished +11.9%.
On a $500,000 portfolio, the 2008 gap alone is roughly $235,000 in losses you never had to hold.
The Allocator is not just a return enhancer, it is a drawdown absorber, and the two together is what lets compounding actually compound.
From now on, the DTO Cycle Allocator sits at the heart of the Defy the Odds framework, the strategic layer the rest of the work builds on:
The Macro Monday Playbook translates the regime into plain language and hunts for opportunities inside it, the multi-month, sometimes year-long, macro setup.
The Intermarket Macro Map finds the profitable rotations inside a single regime, in time.
The deep dives break down the megatrends that shape the macro and the names worth owning.
The stock selection combines macro, fundamentals, and technicals. The last one, FSLR, printed 40% in three weeks. Or the NFLX, TPL, DIOD.
The model gives you the strategic return. Everything around it is built to sharpen it.
Glossary for Defy the Odds is here.
Disclaimer: Nothing here is financial advice. These are reflections on macroeconomics and markets, meant to spark ideas and sharpen decision-making. To truly Defy the Odds, think independently, question everything, and do your own homework.

This is incredible. Defy the Odds is one of my best subscriptions on Substack. Now, the tough part: figure out how to implement for my own portfolio.
The most revealing part of this framework is not the 2008 or 2022 performance. It is 2019 and 2023, the years the model was right about the macro and wrong about the market. That tension is where systematic allocation meets its hardest question. Institutional allocators face the same problem without the discipline of pre-registered rules.
The TAA consensus in 2019 was cautious on equities for precisely the reasons your macro engine flagged, inverted curve, manufacturing contraction, Fed cutting. Most allocators drifted back toward risk exposure anyway, not because their framework changed but because career risk made defensive positioning increasingly difficult to hold. Your architecture accepts the cost explicitly.
Most institutional processes absorb it quietly and invisibly. The 12-point drag in 2019 is honest in a way that most multi-asset track records are not. What does the regime classification show for the current environment?